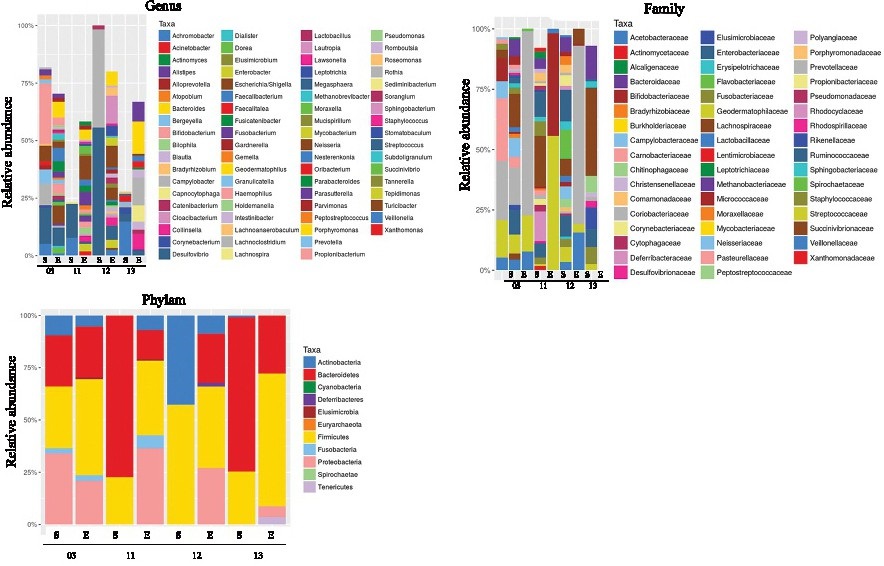
Fig. 6. Microbiota of matched EVs and sputum. The relative abundance of bacterial taxa identified in paired EV and sputum samples has been represented as stacked bar plots. Each bar represents an individual and each colored box, a bacterial taxon, family, phylum and class. The height of a colored box represents the relative abundance at various taxonomic levels as indicated. S: Sputum; E: Extracellular vesicles. The respective patient's number from NTM-BCa group has been shown under each paired sputum and EV samples. A minimum average abundance of 0.05% was considered for calculating the entire taxa abundance.